
In our last article, we compared IP-to-Company capabilities between Clearbit, Kickfire, and ourselves - basically, given an IP address, who can return the right company behind that IP address? Enrichment is a natural add-on capability to IP-to-Company that helps flesh out those company records.
Enrichment is the ability to take a company name or domain, and return a rich set of data attributes, like industry, company size, etc. You can then use this data for use cases like:
- Filling out CRM Account Records - giving your reps additional context about a company helps them tailor communications to be more relevant, like where are they based, how many employees, what industry, etc.
- Targeting/Segmenting ads - e.g. only try to retarget companies that match your target industry/size
- Personalizing page/chat content - e.g. greeting a site visitor by their company name
- Analyzing effectiveness of marketing efforts - see if your marketing is bringing in the kind of visitors you think it should be bringing in
In this article, we’ll explore the quality and depth of enrichment capabilities between Clearbit, KickFire, and ourselves.
High-Level Differences
Before we delve into the head-to-head comparison, let’s first take a look at what results each provider returns:

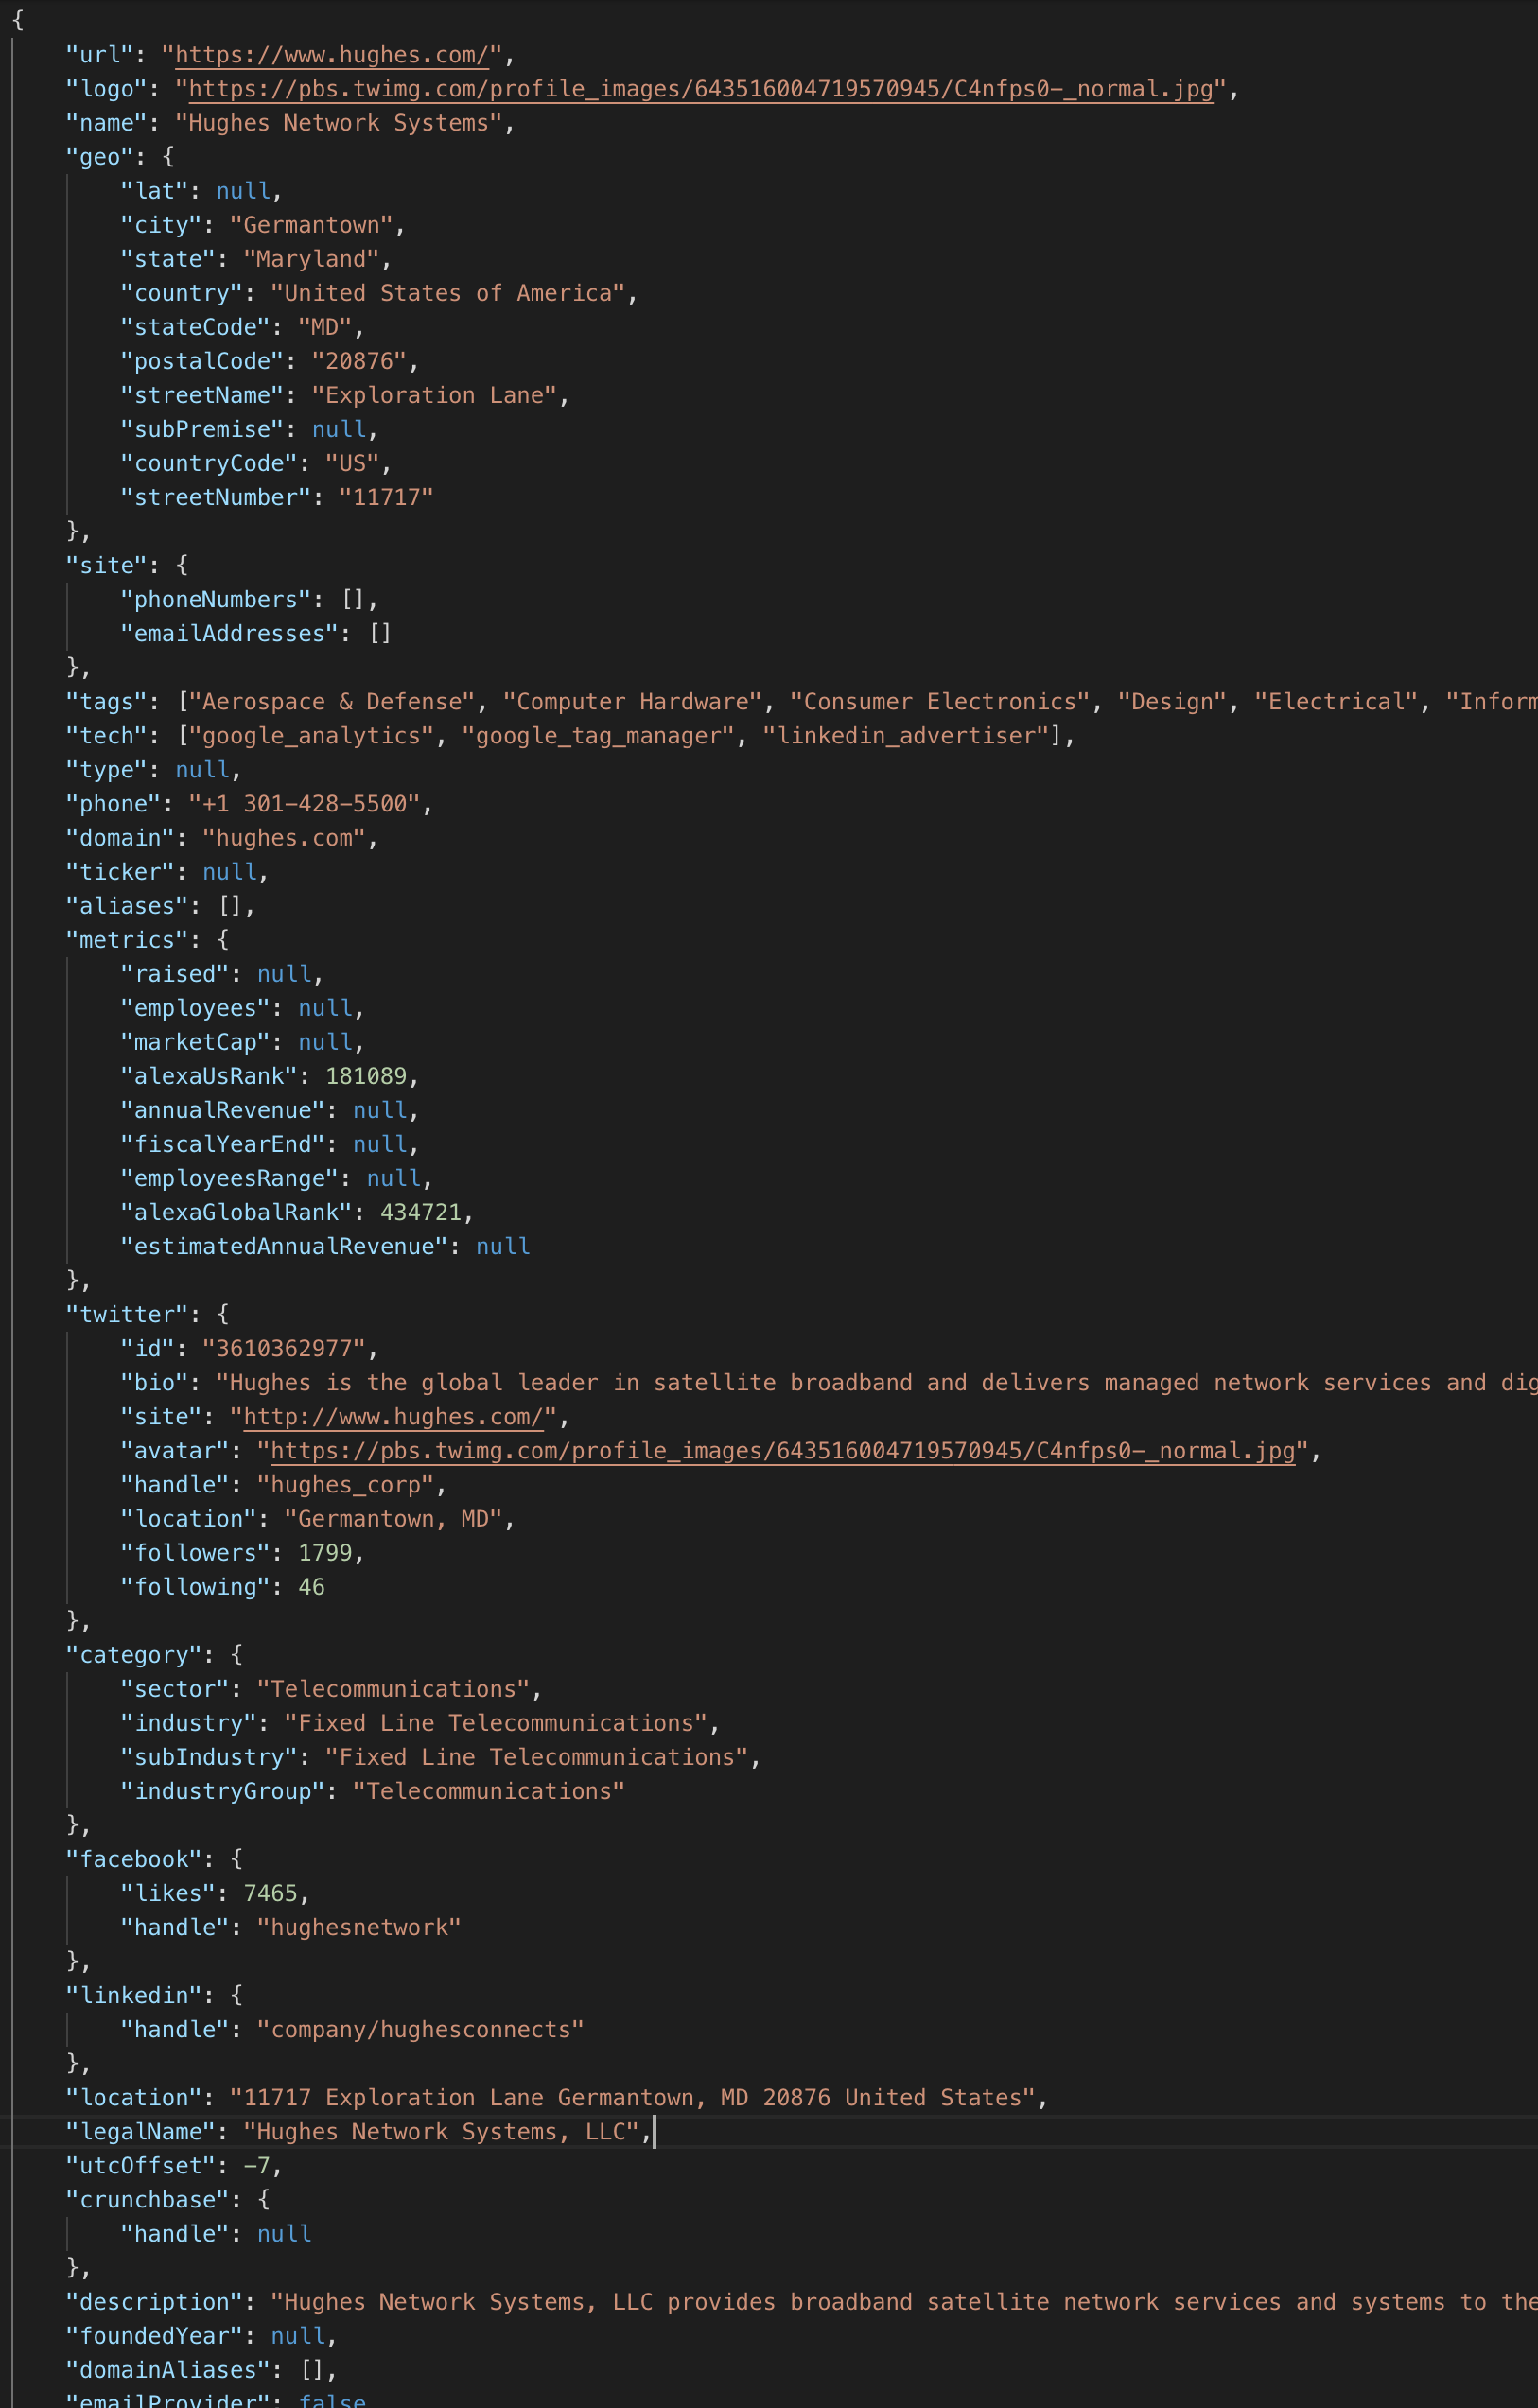

Our return value are structured very similarly to Clearbit- this is by design. Clearbit’s schema is well-thought out, and it seemed unnecessary to reinvent the wheel. Kickfire’s schema is much more straightforward, although it contains less data. That meant weren’t able to compare ourselves to Kickfire on a couple of attributes:
- Technology tags - these are technologies a company is using (typically on their website), which can be very useful for segmenting and targeting companies. For example, if you’re in Ad Tech, you could use this data to only target those who use an ad platform
- Amount of funding raised - usually expressed just as a total dollar figure, this can be useful for further qualifying companies, since it’s a strong signifier of buying power.
Additionally, all three providers use a different industry classification system. Wikipedia’s industry classification systems article gives a good overview of several different systems.
- Clearbit uses their own adaptation of GICS, plus their own additional set of proprietary classification tags
- Kickfire uses NAICS and SIC, which while very well-known, are often viewed as being somewhat antiquated, and often not applicable for modern tech companies
- BigPicture uses ICB, which was launched by Dow Jones and FTSE in 2005, and now used by the NASDAQ, NYSE and several other markets around the globe
Test Methodology
Overall Methodology
In our last comparison, we ran identical IP-to-Company lookups on Clearbit, Kickfire, and our own service. Our goal for this comparison was to be able to compare ourselves to the more established providers in two primary ways:
- How do our fill rates compare, on an attribute-by-attribute basis?
- How well does each system categorize companies into industries?
- How do our records compare in terms of overall completeness? In other words, are we likely to have more complete or less complete records compared to Clearbit and Kickfire?
You might notice we didn’t evaluate correctness for all attributes. That’s because it’s often hard to determine the “true” answer for company data attributes, since often the data is often not public to begin with. For example, most companies will not publicly state the exact number of employees, but almost all enrichment providers will provide a range of number of employees.
Attribute Fill Rate
We wanted to measure how often attributes that are useful to sales and marketing teams are actually returned. We surveyed a few friends in sales and marketing to get an idea of which attributes they thought were most important, and settled on the following:
- Address: State
- Tech tags (not available for KickFire)
- Amount $ raised (not available for KickFire)
- Number of employees
- Twitter account
- Facebook account
- LinkedIn account
- Industry/category/sector
- Stock Ticker
Note that company name and website are not part of the comparison, because those two attributes are always returned if there is a result. Therefore, counting how often name/website are available would be the same as measuring how often company data could be returned, period, which was essentially what we looked at in the last article.
To compare fill rates for attributes, we compared each company result returned from Clearbit and Kickfire to ours, to see which attributes had a value returned. We scored every attribute for each company like so:
- If BigPicture returned an attribute where Clearbit/KickFire didn’t, we scored ourselves a 1. Vice-versa, if Clearbit/Kickfire returned an attribute where BigPicture didn’t, we scored ourselves a -1
- If both BigPicture and Clearbit/KickFire returned an attribute, or if neither returned a value, we scored that as a 0
- If Clearbit/KickFire did not return a result for a company, we ignored that company.
We then summed the scores for each attribute, across the entire set of companies we tested. A positive score for an attribute would mean that BigPicture was able to return a value more often than our competitor. Obviously, a negative value meant the competitor was able to return a value more often.
However, Tech Tags and Domain Aliases needed to be scored differently, because the return values are lists. To compare these, we just counted the number of values in the list and compared that. Note that we only compared ourselves to Clearbit for these attributes, since KickFire does not return either of these. We scored these attributes as follows:
- 1 if BigPicture returned at least 10% more values in the list than Clearbit
- 0 if we’re within 10% of Clearbit
- -1 if Clearbit returned at least 10% more values than we did
Finally, we summed the individual attribute scores, and divided by the total number of results to get a sense of how we compared on a per-attribute basis, with the resulting negative/positive percentage indicating whether we were less/more likely to be able to return data for each attribute.
Industries/Categories
As mentioned before, judging correctness of the attributes returned between different providers is challenging because there’s often no public source of truth. However, we didn’t want to completely ignore correctness, so we chose Industry/Category as an area to try to evaluate data quality beyond just fill rate.
Since the “correct” Industry/Category for a company is highly subjective, we compared a random subset of the data by hand. We scored this much in the same way as we did for attribute fill rates:
- 1 if our answer looked more correct than Clearbit/KickFire
- 0 if we both looked equally correct (or equally wrong)
- -1 if Clearbit/KickFire’s answer looked more correct than ours
Overall Completeness
To compare overall completeness, we summed the attribute scores for each company and plotted these on a histogram. By summing the attribute scores for each company, we are basically summarizing whether our record is more or less complete compared to Clearbit/KickFire (a positive score meaning our record was more complete, and a negative score meaning theirs was more complete). Then by putting these scores in a histogram, we can get an overall sense of where our company records lie in comparison.
Test Limitations
As mentioned above, the primary limitation with this test is the difficulty in examining the correctness of every attribute. We don’t see a practical way to do this at large scale, so we focused primarily on fill rates instead.
And as with part one of this comparison to Clearbit and KickFire, we recognize that results may vary greatly with different samples of traffic. We took a sample of traffic from our customer base to do the lookups with, but obviously the sample we took may not be representative of your, or an individual customer’s actual traffic.
The Results
Attribute Fill Rate
First, let’s look at fill rates. We compared ourselves to Clearbit, and ourselves to KickFire. We made no attempt to compare Clearbit and KickFire to each other directly, but you can probably read between the lines to draw your own conclusions.

Let’s address the elephant in the room first: Clearbit does a lot better than us at tech tags. KickFire doesn’t have this data, which is why there’s no red bar for that attribute (or the amount of funding raised). For almost half the results, Clearbit had more tech tags than we did.
Let’s take a closer look. Here’s a histogram of all the tech tags that we saw Clearbit return, along with how frequently they were returned:

There’s a significant long tail that Clearbit can detect - 135 unique tags from what we saw. Of those 135 tech tags, the top 43 account for 80% of the tech tags returned. BigPicture is able to detect 38 of these top 43, so the large gap in fill rate between Clearbit and BigPicture is most likely due to Clearbit's long tail of tech tags they can detect. In practical terms however, we should be highly comparable to Clearbit when it comes to the most common tech tags.
Both Clearbit and KickFire also do better at returning number of employees and LinkedIn handles for a company. We readily acknowledge that we could do a better job at returning the number of employees, as this hasn’t yet been a focus for us. We plan to make improvements in this area in the next year though. The LinkedIn company profile is of more dubious value. It can be highly useful for quickly looking up contacts by hand on the LinkedIn site, but many customers we’ve talked to already use a data provider or some automated solution to do the same thing. And while LinkedIn is trying to vie for a bigger piece of the attention pie when it comes to social media posting, they’re still far behind Facebook and Twitter.
For most of the other attributes, we are within a 5% margin of Clearbit and Kickfire. We don’t see a 5% difference being very meaningful, given that this is a random sample of traffic, and we could see that difference shift with a different data set. The only two exceptions to this are Twitter handle, where we seem to perform somewhat better than Kickfire, and Facebook handle, where KickFire performs a little better than us.
Industries/Categories
We hand-scored a subset of data to see who returned more accurate industry/category information. We found that, for the sample tested, we were 4% better than Clearbit, and 10% worse than KickFire. Clearly, we have something to learn from KickFire here. Compared to Clearbit, we don’t consider 4% to be a significant performance difference, but we did find it interesting that Clearbit was clearly wrong for several companies that should have been easy to categorize:

Overall Completeness
When it comes to how we compare overall to Clearbit and KickFire, we used a histogram to plot number of results against the total “score” we calculated. Again, negative scores mean our competitor’s record was more complete than ours, and positive scores meant ours was more complete:

We can see that on average, Clearbit is going to have a more complete record than us, as indicated by the left-centered blue distribution. We are more evenly matched with KickFire, as evidenced by the red distribution being centered right at 0, with a slight left-skew. However, remember that KickFire returns much less data to begin with, and we only compared on attributes that we both return.
Conclusion
When we initially set out to do this analysis, we wanted an honest assessment of where we stood against the established players in the field for two reasons:
- So we could understand how far behind (or ahead) we were from these major players
- To understand the key areas of improvement where we should be investing
Both Clearbit and KickFire are much larger companies than we are, and clearly, we cannot say we’re ahead of either of these players, but that’s what we expected from the beginning. The strength of our product offering lies more in being able to use the data than it the data itself, at a more competitive price point. This being said, we were happy to see we’re comparable against both, and along with the rest of our product offering we’re confident we offer compelling value for sales and marketing teams.
More importantly, we’re not afraid to bare what we have. We stand behind our product, and invite you to come check us out and get a demo. Our strength lies not just in having reverse-company lookup data, but in being able to do something with it. If you’d like to learn more, feel free to schedule a chat with us and we’d be happy to discuss further.